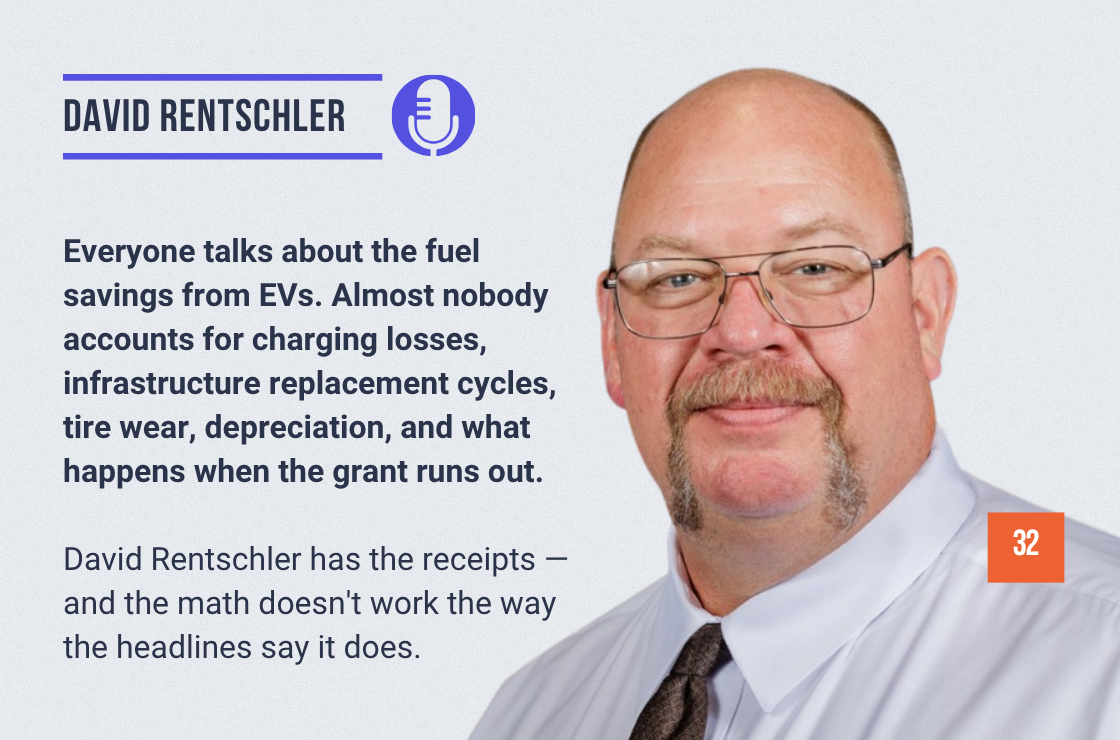
David Renschler is the Fleet Manager for the City of Fairfield, California, where he has led fleet operations since 2007 and built one of the nation’s top-recognized public fleets — earning a spot on the 100 Best Fleets list every year since 2009. He was named Government Fleet Manager of the Year at GFX in 2022, has testified before Congress on fleet electrification, and has engaged with the California Air Resources Board since 2008 as an advocate for realistic, data-driven EV policy. In 2023 he launched a consulting practice specifically to counter the misinformation circulating in the electrification space.<
Here’s a glimpse of what you’ll learn:
- [1:39] How losing the family farm in the 1980s led to a four-decade career in fleet
- [3:55] What being a good steward of the taxpayer dollar actually looks like in practice
- [5:17] How David manages 24 vehicle replacement funds and plans replacements through 2050
- [9:21] Where the EV market actually is today versus where the headlines say it is
- [13:08] The $7.8 million vs. $300,000 decision that shaped Fairfield’s electrification strategy
- [22:24] EV math explained: charging losses, infrastructure cost recovery, and the real cost per mile
- [33:39] Why EV bus tires cost nearly double and wear out in half the miles of diesel equivalents
- [38:44] The depreciation gap between a Ford Lightning and a gas F-150 at five years
- [41:45] Where to go and who to call before electrifying your fleet
In this episode…
The EV conversation in fleet has been running on two tracks simultaneously. On one track: headlines, mandates, grant announcements, and the promise that fuel savings will offset everything. On the other: fleet managers with spreadsheets, receipts, and real-world data who keep running the numbers and getting a different answer.
David Rentschler has been on the second track for years. As Fleet Manager for the City of Fairfield, California, he manages everything from police cruisers to 50 transit buses under a $9.5 million operating budget, operates as a business with a monthly P&L, and has been building replacement projections through 2050 since before most fleets had a three-year plan. He is not anti-EV. He is pro-math.
In this Roadrageous episode, David walks through what he calls EV math — the full cost accounting that most electrification analyses leave out. Charging losses between the meter and the battery. Infrastructure replacement cycles nobody budgets for. Tire costs on battery electric buses that are nearly double those on diesel. A depreciation rate on the Ford Lightning that is 16 points higher than the gas F-150 at five years. And a real-world fuel cost that, for his transit operation, works out to more than $15 per mile — versus 75 cents for diesel.
The Taxpayer Stewardship Standard
Before getting into the numbers, David establishes the standard by which he evaluates every decision: not cheapest, but best value. For a public fleet manager, that means optimizing across the full life of every asset — from specification through disposal — with the interests of taxpayers, not politicians or vendors, as the governing principle.
“Our number one job outside of being safe is to be a good steward of the taxpayer dollar. Being good stewards isn’t necessarily finding the cheapest way to do something, but the best way.”
In practice, this means studying historical data before buying parts, running pilot programs before committing to new technology, writing vehicle specifications collaboratively with end users, and managing 24 separate replacement funds that account for every vehicle in the fleet on a projected schedule through 2050. It also means disposing of assets in ways that maximize return — including selling older trucks to the local school district at fair market value rather than sending everything to auction.
When David took over as fleet manager in 2007, the operation was averaging 1% ROI at disposal — vehicles were being run until they stopped running and then auctioned for almost nothing. Today the fleet averages 18% pre-COVID. The shift from reactive maintenance to proactive life cycle management is where that number came from.
The $7.8 Million Decision
Two years before this conversation, David built a presentation for Fairfield’s senior leadership team that laid out the full cost of CARB compliance through 2030. California law requires government entities to purchase 50% of eligible vehicles as zero-emission, rising to 100% by January 1, 2029. For Fairfield, that meant running the numbers on what electrifying the fleet’s heavy-duty vehicles would actually cost.
The answer was $7.5 to $7.8 million in additional funds above and beyond normal replacement costs — based on vehicles that, at the time, had not yet been produced and were either pre-order or theoretical. The electric dump truck cost was estimated by taking the bed cost from a recently purchased diesel unit and adding it to the price of a Kenworth T680E electric tractor, arriving at approximately $758,000 per unit.
The alternative: buy enough Ford F-150 Lightnings and Explorers to satisfy the compliance threshold through 2030, at a cost differential of just over $300,000. David presented both options to the city manager and finance director without a recommendation — just the numbers.
“Do you want to spend just over $300,000 extra to buy Lightnings, or should we spend just over $7.8 million extra to go zero emission on vehicles that are not tested and may or may not be a problem? They’re first to market. There’s always issues first to market. We know Ford’s not going to go out of business.”
They chose the $300,000 option. The strategy bought the city breathing room through the end of FY29 — enough time to watch how regulations evolve, who becomes California’s next governor, and what the 2028 federal election produces.
EV Math: What the Fuel Cost Analysis Actually Shows
The core of David’s EV math argument starts with a fact that almost nobody accounts for: electricity, unlike liquid fuel, loses a measurable percentage between the point where you pay for it and the point where it reaches the battery.
“If you go to a gas pump and you take a one gallon gas can, Weights and Measures guarantees you that if you got one gallon on the meter, you have one gallon in your gas can. It’s not that way with electricity. From the meter to the charger, you’re going to lose 5%. From the charger to the battery of the vehicle, you’re going to lose another 12%. So if you want to put 100 kilowatts in the battery of your EV, your charger will have to put out 114 kilowatts — and the meter where you pay, you’re going to pay for 120 kilowatts.”
This means that EV manufacturer efficiency ratings — expressed in miles per kilowatt — are calculated from kilowatts out of the battery, not kilowatts out of the charger or off the meter. A vehicle rated at 3 miles per kilowatt will cost significantly more per mile to fuel than that number implies, once the metered cost is used in the calculation.
David’s own Lightning averages 2.1 miles per kilowatt. At Fairfield’s electricity rates of 36 to 54 cents per kilowatt hour, the fuel cost works out to approximately 18 to 19 cents per mile — from the battery. Add the 17% charging loss markup and the true cost per mile rises further. A gas F-150 V6 getting 20 miles per gallon at $5.99 per gallon comes out to approximately 30 cents per mile. At the national average of $4.46 per gallon, that drops to about 22 cents.
For light vehicles, the gap is real but manageable — especially if electricity rates are lower than California’s. For transit buses, the math becomes indefensible.
When the Infrastructure Loan Shows Up in the Fuel Cost
The $3.2 million charger construction project currently underway at Fairfield was funded through a combination of state and local grants and a $1.2 million, zero-interest, seven-year loan from another agency. That loan costs $15,000 per month. The chargers that loan funded must generate enough throughput to service that cost — in addition to the cost of electricity itself.
At current usage of approximately 98,000 kilowatt hours per year across 10 Level 3 and 4 Level 2 chargers, the all-in cost per kilowatt hour reaches $7.58. A transit bus consuming 2 kilowatts per mile at that rate produces a fuel cost of over $15 per mile. Diesel at $6.50 per gallon costs approximately 75 cents per mile. The electric bus itself cost $1.5 million — the diesel equivalent costs $780,000.
“How is paying $1.5 million for an electric bus versus $780,000 for a straight diesel bus being a good steward of the taxpayer dollar? I’ve got half the price on diesel and I’m getting 65 cents a mile fuel cost. Or I could pay double the capital cost and over 10 times the fuel cost. How does that work?”
David is clear that these numbers reflect Fairfield’s specific infrastructure utilization, electricity rates, and operational profile. They are not a universal verdict on EV economics. But they are what the math looks like when you do it completely — and they are precisely what gets omitted from most electrification cost analyses.
The Hidden Costs Nobody Budgets For
Beyond fuel cost, David identifies three additional cost categories that consistently get underestimated or ignored entirely in EV adoption analyses.
Tires on battery electric buses wear significantly faster than on diesel or hybrid equivalents, require specialized tires that cost more per set, and produce a per-mile tire cost that is nearly double. David’s electric buses get 15,000 miles from a set of rear tires at $3,290 per set. His hybrid and diesel buses run equivalent tires for 26,000 to 27,000 miles at $2,660 per set.
EV chargers are not long-lived capital assets. With digital displays, cellular connectivity, onboard processors, and active power management, they have a realistic replacement cycle of five to seven years. Level 2 chargers run $13,000 to $15,000 for a current ChargePoint unit with a five-year warranty and cloud plan. Level 3 chargers cost $150,000 each. All of this needs to be reflected in a replacement fund and amortized into fuel cost — not treated as a one-time capital item.
Depreciation on the Ford Lightning runs approximately 56% at five years versus 40% for the gas F-150 over the same period. A higher initial purchase price combined with a faster depreciation rate means lower residual value and a worse ROI at disposal — compounding the capital cost disadvantage over the vehicle’s full life.
Quotable Moments:
- Our number one job outside of being safe is to be a good steward of the taxpayer dollar. Being good stewards isn’t necessarily finding the cheapest way to do something, but the best way.
- 2 + 2 will never ever equal 4. Most of the time it equals 6 or 1.5. You never know.
- You pay for 120 kilowatts, but you only get 100 in the battery. That’s the math that nobody does.
- How is paying $1.5 million for an electric bus versus $780,000 for a straight diesel being a good steward of the taxpayer dollar?
- Be the expert in the room. Be the one that knows the information to further your interests. Because they’ll eat you alive if you’re not informed.
- I hate consultants. I became one in 2023 to help other fleets out because there was so much misinformation from consultants that didn’t know what they were talking about.
Action Steps:
- Run the complete EV fuel cost calculation. Before running any EV cost analysis, build a model that accounts for meter-to-charger loss (5%), charger-to-battery loss (12%), and apply those to your actual local electricity rate. OEM efficiency ratings are battery-out figures, not meter figures.
- Build a charger replacement fund immediately. Budget charger replacement at five to seven years. Level 2 units run $13–15K per charger; Level 3 units run $150K. Start a replacement fund at acquisition and amortize that cost into your fuel rate from day one.
- Map your compliance exposure with a cost differential analysis. Project your fleet replacement schedule and compliance obligations out at least through 2030, with cost differentials between compliant and non-compliant options clearly documented. Present leadership with options and numbers — not recommendations.
- Find peers with real-world EV operating data. Join NAFA, MEMA, or APWA and connect with fleet managers who have already been through EV adoption. Ask for real operating data — fuel cost per mile, tire costs, downtime rates, charger reliability. The community shares openly.
- Engage with regulators before mandates are finalized. Get involved in the regulatory process before rules are finalized. Attend CARB hearings, comment periods, or equivalent bodies in your state. Fleets that engaged early shaped more realistic compliance timelines than those that waited.
Key Takeaways
- EV fuel cost calculations based on OEM efficiency ratings are understated by approximately 17% — the charging losses between the meter and the battery that most analyses ignore.
- Infrastructure cost must be included in EV fuel economics. A $1.2 million charger loan at $15,000/month, amortized across 98,000 kWh of annual throughput, produces a fuel cost of $7.58/kWh — over $15/mile for a transit bus.
- EV bus rear tires cost nearly double per mile compared to diesel or hybrid equivalents due to higher weight, specialized tire requirements, and significantly shorter service life.
- Ford Lightning depreciation runs 56% at five years versus 40% for the gas F-150 — a higher initial price combined with faster depreciation compounds the total cost of ownership disadvantage.
- Government fleets in California remain compliance organizations regardless of grant availability or political climate shifts. Planning must account for regulatory scenarios across multiple election cycles.
- The fleet professional community is unusually willing to share real-world operating data. Professional organizations and peer networks are the fastest path to honest EV cost benchmarks.
Conclusion
David Renschler is not trying to stop electrification. He is trying to make it honest. After nearly two decades managing one of the country’s top-recognized public fleets — through predecessor embezzlement, multiple political administrations, a pandemic, and now a federal policy reversal on EV grants — he has developed a simple standard for evaluating any decision: what does the complete math say, and is it the best value for the people paying for it?
For fleet managers navigating electrification mandates, that standard is both a shield and a compass. The mandates are real. The compliance obligations for California government fleets are not going away. But the path to compliance that costs the least and performs the best requires doing the full calculation — not the version that stops at fuel savings and calls it a day. David’s framework, built on 17 years of operating data and refined through $15-per-mile lessons, is as close to a complete model as the industry has publicly produced.
Resources mentioned in this episode:
About David Rentschler
David Renschler is the Fleet Manager for the City of Fairfield, California, where he has led fleet operations since 2007 and earned recognition on the 100 Best Fleets list every year since 2009. He was named Government Fleet Manager of the Year at GFX in 2022, has testified before Congress on EV infrastructure and fleet electrification, and has been engaged with the California Air Resources Board since 2008. He launched a fleet electrification consulting practice in 2023 to provide government and private fleets with data-grounded guidance in a space he describes as overrun with misinformation.
Sponsor
IMPROVLearning — At IMPROVLearning, we are dedicated to transforming driver education through innovative, research-backed training methods. Our SPIDER Driver Training platform combines humor with proven brain-training techniques to help drivers anticipate and avoid dangers on the road. David Renschler’s standard is clear: good stewardship means making sure the vehicle, the infrastructure, and the people operating them are all performing at their best. SPIDER training develops hazard recognition, space management, and split-second decision-making under pressure — because the right vehicle on the right route still requires a trained driver to make it safe. Visit improvlearning.com.