Why the small ones add up faster than most fleets think
A driver backs into a pole.
No one is hurt. The van still runs. The customer still gets the delivery. Everyone exhales.
On paper, it looks minor.
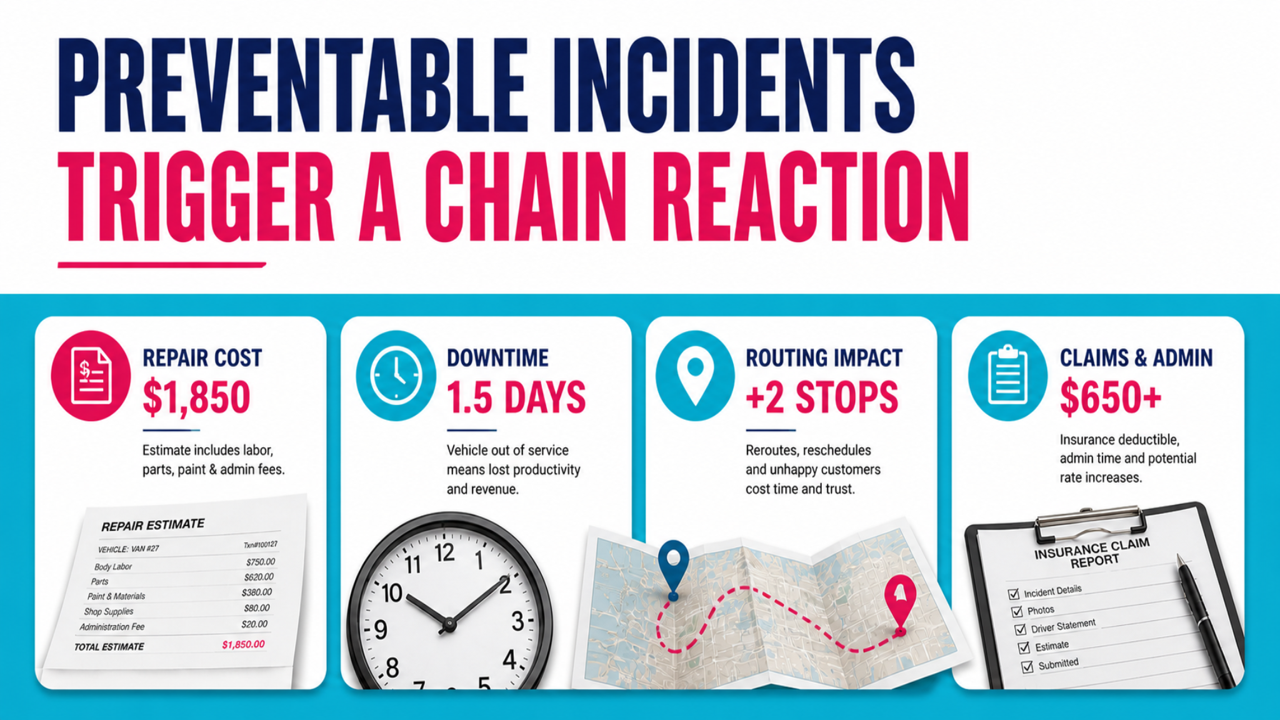
Then the bill starts building.
There is the repair estimate. Then the downtime. Then the reroute. Then the supervisor’s follow-up. Then the claim notes. Then the replacement vehicle. Then the customer call. Then the coaching conversation with a driver who says, honestly, “I’ve done that maneuver a hundred times.”
That is the hidden reality of preventable fleet incidents: they often begin as ordinary decisions, but they rarely stay small once the cost moves through the business.
The menu of everyday risk
Most fleets are not dealing with catastrophic crashes every day. They are dealing with the repeatable stuff.
Backing into fixed objects. Parking lot scrapes. Low-speed collisions. Rear-end crashes in traffic. Sideswipes during turns or merges. Mirror strikes. Minor yard and depot incidents.
Individually, these events can look like the cost of doing business. Collectively, they become a business problem.

This is why fleet safety cannot be limited to the dramatic crash. For many organizations, the more common financial drain comes from low-speed, high-frequency incidents that quietly become normalized inside the operation.
A scrape here. A backing incident there. A clipped mirror. A delayed route. A customer complaint. A vehicle out of service.
The incident may be small. The pattern is not.
The repair bill is only the first line item
One of the biggest mistakes in fleet safety is treating the repair invoice as the cost of the incident.
It is usually just the visible part.
NHTSA’s economic crash-cost framework includes far more than property damage. It accounts for lost productivity, medical costs, legal and court costs, emergency services, insurance administration, congestion, property damage, and workplace losses.¹ OSHA’s employer guidance makes the same practical point: motor vehicle crashes create costs through medical care, legal expenses, property damage, lost productivity, and administrative overhead.²
For fleets, those categories show up in everyday operational language.
A supervisor stops managing the day and starts managing the incident. Dispatch reworks the route. A replacement vehicle is pulled in. A driver is paid for non-driving time. A claim is opened. A customer gets an explanation. The body shop gets a call. The schedule bends around the problem.
That is the full bill.

In the modeled example, common preventable incidents can consume approximately $500,000 per year per 100 vehiclesonce repairs, downtime, replacement coverage, third-party damage, claims handling, supervisor time, driver paid time, towing, and miscellaneous costs are included.
That figure is not meant to be an actuarial estimate for every fleet. It is a practical planning model. The point is simple: when leaders only count the repair bill, they undercount the incident.
Why familiar work becomes risky work
Many preventable incidents are not caused by a driver who lacks basic knowledge.
They are caused by small gaps in attention, judgment, timing, and habit.
A driver backs before fully resetting. Takes a turn slightly too tight. Follows a little too closely. Moves too quickly through a familiar lot. Assumes the dock area looks the same as yesterday. Checks the next stop before completing the current one.
The brain is efficient. When a task becomes familiar, it starts to feel safer than it actually is. That is useful for routine work, but risky in dynamic driving environments.
A route may be familiar. A parking lot may be familiar. A delivery dock may be familiar. But the conditions are never identical.
A cone moves. A parked car appears. A gate is open. A pedestrian steps out. A customer blocks the usual approach. A driver’s “normal” pattern no longer fits the moment.
That is where preventable cost begins.
The better question for fleet leaders
After an incident, it is natural to ask, “Why did this driver make a bad decision?”
A better question is: What made this decision feel normal?
That question moves the conversation from blame to behavior. It helps leaders look for patterns:
Where are the same incident types repeating? Which drivers show similar risk behaviors? Which routes, yards, depots, or delivery environments create the most exposure? Which small decisions are showing up before damage occurs?
This is where safety data becomes more useful. Not as a scoreboard. Not as a compliance archive. As a behavioral map.
Telematics can identify the pattern. Coaching can translate the pattern into a behavior the driver can change. Training can reinforce that behavior over time, before the next small decision becomes another line item on the bill.
Small choices. Big impact.
A scrape avoided is more than a repair avoided.
It is a route kept intact. A supervisor kept focused. A customer kept satisfied. A claim never opened. A vehicle kept productive. A driver kept out of the incident cycle.
Nationally, the cost of crashes is staggering. The National Safety Council estimates that motor vehicle crashes cost $559.3 billion in 2024.³ NETS reported that traffic crashes cost U.S. employers $72.2 billion in 2019 in direct crash-related expenses, including medical care, liability, lost productivity, and property damage.⁴
But for a fleet leader, the real story is not only national cost. It is operational leakage.
Preventable incidents do not only damage vehicles. They quietly tax the entire business.
And once you see the full bill, it becomes much harder to ignore the menu.
References
- Blincoe, L., Miller, T., Wang, J.-S., Swedler, D., Coughlin, T., Lawrence, B., Guo, F., Klauer, S., & Dingus, T. (2023). The Economic and Societal Impact of Motor Vehicle Crashes, 2019 Revised. National Highway Traffic Safety Administration, Report No. DOT HS 813 403. https://crashstats.nhtsa.dot.gov/Api/Public/ViewPublication/813403.pdf
- Occupational Safety and Health Administration, National Highway Traffic Safety Administration, & Network of Employers for Traffic Safety. Guidelines for Employers to Reduce Motor Vehicle Crashes. https://www.osha.gov/sites/default/files/publications/MOTOR_VEHICLE_GUIDE.pdf
- National Safety Council. Motor Vehicle: Overview and 2024 Crash Highlights. NSC Injury Facts. https://injuryfacts.nsc.org/motor-vehicle/overview/introduction/
- Network of Employers for Traffic Safety. (2021). Cost of Motor Vehicle Crashes to Employers: 2019. https://trafficsafety.org/road-safety-resources/public-resources/cost-of-motor-vehicle-crashes-to-employers-2019/